Technical Analysis: Crypto - Dow Jones - Precious Metals - Oil - Exchange Rates - S&P500 - |
Fundamental Analysis: Market Cap. Mega Caps Large Caps Mid Caps Small Caps Volume Revenue Rev. Growth Net Income Profit Margin Forward PE Forward PS P/E Ratio Rev. growth next 5y Rev. growth this Q |
Visuals: Revenue vs. Net income Revenue vs. Net income logaritmic |
Tools: Search Compare Watchlist Shortlist Portfolio |
Articles: P/E Ratio |
Beursrally: Watchlist Top 10 winners and losers since start Top 100 winners and losers since start Shortlist |
Buy: MACD Histogram up RSI change above 30 SMA50 up Volume Pct Change |
Sell: MACD Histogram down RSI change below 70 |
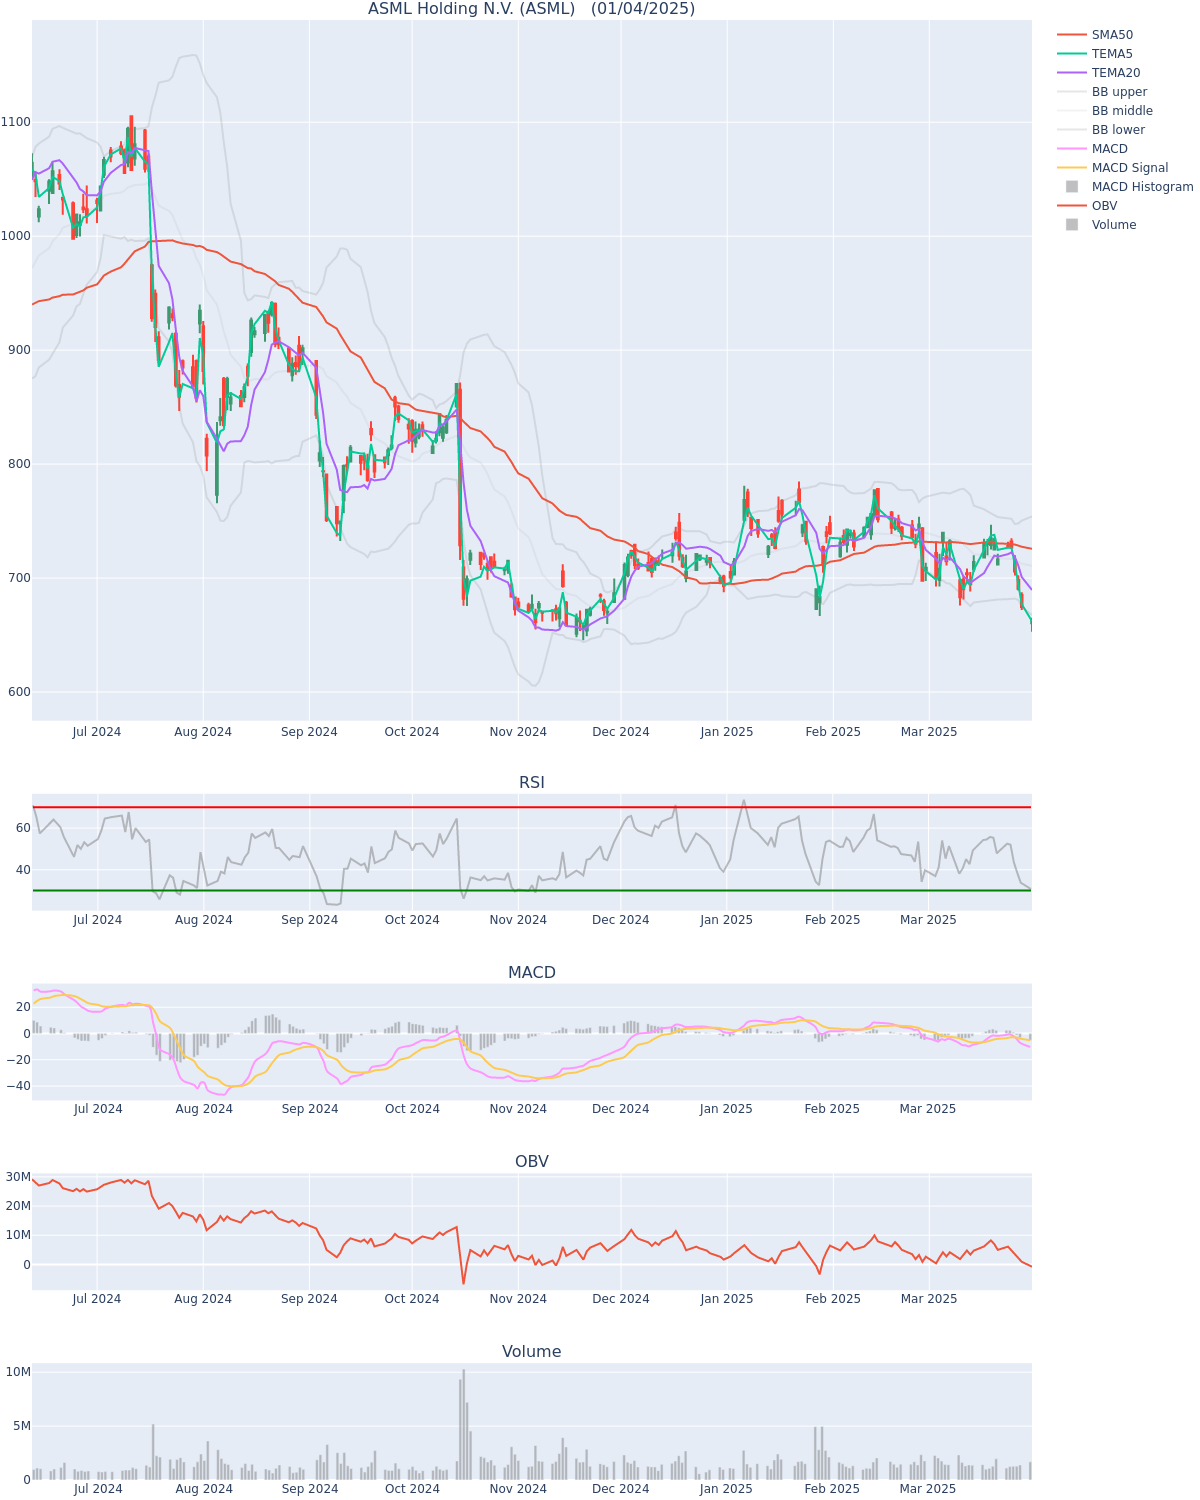
![]() |
Feature | |
---|---|
Ticker | ASML |
Market_cap | 281.257.114.428,00 |
Stock_price | 727,70 |
%_change | -1,55 |
Industry | Semiconductor Equipment & Materials |
Volume | 1.311.200,00 |
Pe_ratio | 36,31 |
Ent_value | 271.807.307.937,00 |
Company | ASML Holding N.V. |
Mc_group | Mega-Cap |
Sector | Technology |
Forward_pe | 28,90 |
Exchange | NASDAQ |
Div_yield | 0,89 |
Div_$ | 6,51 |
Last_div | 1,35 |
Div_growth | -0,24 |
Years | 1,00 |
Div_cagr_5y | 19,88 |
Change_1w | -1,57 |
Change_1m | -5,31 |
Change_3m | 10,02 |
Change_6m | -13,68 |
Change_ytd | 5,00 |
Change_1y | -19,58 |
Return_3m | 10,02 |
Change_3y | 11,47 |
Change_5y | 135,08 |
Change_10y | 622,00 |
Change_15y | 2.241,38 |
Change_20y | 4.050,70 |
Return_1w | -1,57 |
Return_1m | -5,31 |
Cagr_1y | -19,05 |
Cagr_5y | 19,67 |
Cagr_3y | 4,75 |
Cagr_10y | 23,00 |
Return_20y | 7.899,34 |
Return_15y | 3.889,80 |
Return_10y | 692,96 |
Return_5y | 145,54 |
Return_3y | 14,94 |
Return_1y | -19,08 |
Return_6m | -13,48 |
Return_ytd | 5,00 |
Cagr_15y | 27,86 |
Cagr_20y | 24,50 |
52w_low_chg | 12,74 |
52w_high_chg | -34,45 |
Ath | 1.110,09 |
Ath_chg_% | -34,45 |
Ath_date | 2024-07-11 |
Atl | 2,02 |
Atl_chg_% | 35.978,33 |
Atl_date | 1995-03-20 |
Pdivffo | |
Ffo | |
Website | https://www.asml.com |
Cusip_number | N07059210 |
Isin_number | USN070592100 |
Cik_code | 937.966,00 |
Sic_code | 3.559,00 |
200ma_chg_% | -12,78 |
50vs200_ma | 50under200 |
150ma_chg_% | -7,80 |
50ma_chg_% | 0,91 |
200_ma | 834,34 |
20_ma | 733,91 |
Int_cov | -466,28 |
Views | 175,00 |
Eps_gr_next_5y | 18,74 |
Rev_gr_this_y | 14,93 |
Rev_gr_next_y | 13,51 |
In_index | NASDAQ100 |
Rev_gr_next_5y | 12,71 |
Tags | artificial-intelligence |
Return_ipo | |
Return_ipo_open | |
50_ma | 721,14 |
150_ma | 789,23 |
20ma_chg_% | -0,85 |
Last_split_date | 2007-10-01 |
Z-score | |
F-score | 6,00 |
Eps_gr_this_q | 68,80 |
Eps_gr_next_q | 37,07 |
Eps_gr_this_y | 22,95 |
Eps_gr_next_y | 23,93 |
Rev_gr_this_q | 47,15 |
Rev_gr_next_q | 26,08 |
Debt_div_fcf | 0,40 |
Tax_rate | 18,04 |
Tax_div_revenue | 5,90 |
Equity | 19.089.299.256,00 |
Working_capital | 11.040.237.046,00 |
Net_wc | -2.208.770.614,00 |
Wc_turnover | 3,03 |
Last_stock_split | Reverse |
Roic | 33,33 |
Rating | Buy |
Analysts | 7,00 |
Price_target | 956,75 |
Pt_upside_% | 31,48 |
Open | 739,05 |
Low | 723,75 |
High | 742,32 |
Close | 739,13 |
Premkt_price | 739,43 |
Premkt_chg% | 0,04 |
Premkt_close | 739,13 |
Afterhr_price | 725,00 |
Afterhr_chg% | -0,37 |
Afterhr_close | 727,70 |
52w_low | 645,45 |
52w_high | 1.110,09 |
Country | Netherlands |
State | |
Employees | 42.416,00 |
Empl_change | 3.330,00 |
Empl_growth | 8,52 |
Founded | 1.984,00 |
Ipo_date | 1995-03-15 |
Last_report_date | 2024-12-31 |
Fy_end | December |
10k_date | 2024-02-14 |
Revenue | 29.440.520.833,00 |
Rev_growth | 2,56 |
Rev_growth_q | 27,99 |
Rev_growth_3y | 14,94 |
Rev_growth_5y | 19,05 |
Rev_growth_yrs | 12,00 |
Rev_growth_qtrs | 2,00 |
Gross_profit | 14.972.404.573,00 |
Gp_growth | 2,52 |
Gp_growth_q | 28,85 |
Gp_growth_3y | 13,89 |
Gp_growth_5y | 22,38 |
Op_income | 9.321.695.936,00 |
Opinc_growth | -0,22 |
Opinc_growth_q | 40,28 |
Opinc_growth_3y | 10,16 |
Opinc_growth_5y | 26,45 |
Netinc_growth_3y | 8,77 |
Netinc_growth_q | 31,51 |
Netinc_growth | -3,41 |
Net_income | 7.887.083.333,00 |
Netinc_growth_5y | 23,91 |
Netinc_growth_yrs | |
Netinc_growth_qtrs | 2,00 |
Income_tax | 1.736.311.284,00 |
R&d_div_rev | 15,10 |
Ps_ratio | 9,55 |
Pb_ratio | 14,73 |
Evdivearnings | 34,46 |
Evdivebit | 28,50 |
Fcf_yield | 3,34 |
Payout_freq | Quarterly |
Avg_volume | 2.039.180,00 |
Beta_5y | 1,10 |
Short_%_float | |
Short_ratio | 1,02 |
Debt_div_ebitda | 0,36 |
Debt_div_equity | 0,20 |
Quick_ratio | 0,86 |
Current_ratio | 1,53 |
Inv_turnover | 1,40 |
Asset_turnover | 0,66 |
Prof_div_employee | 185.946,00 |
Rev_div_employee | 694.090,00 |
Eps | 20,04 |
Eps_growth | -3,27 |
Ebit | 9.538.450.730,00 |
Ebitda | 10.487.501.989,00 |
Operating_cf | 11.536.355.503,00 |
Sbc | 178.321.628,00 |
Sbc_div_rev | 0,61 |
Eps_growth_q | 31,54 |
Eps_growth_3y | 10,29 |
Eps_growth_5y | 25,62 |
Eps_growth_yrs | |
Eps_growth_qtrs | 2,00 |
Investing_cf | -2.695.797.354,00 |
Financing_cf | -2.925.983.094,00 |
Net_cf | 5.921.187.213,00 |
Capex | -2.135.726.934,00 |
Fcf | 9.400.628.568,00 |
Fcf_div_share | 23,90 |
Fcf_growth | 176,75 |
Fcf_growth_q | 238,34 |
Fcf_growth_3y | -2,92 |
Fcf_growth_5y | 29,38 |
Total_cash | 13.249.007.660,00 |
Total_debt | 3.799.201.169,00 |
Debt_growth_yoy | -20,60 |
Debt_growth_qoq | -21,63 |
Debt_growth_3y | -7,08 |
Debt_growth_5y | 3,42 |
Fcf_-_sbc | 9.222.306.940,00 |
Net_cash | 9.449.806.491,00 |
Net_cash_growth | 143,40 |
Cash_div_mcap | 3,36 |
Assets | 50.200.327.715,00 |
Liabilities | 31.111.028.459,00 |
Gross_margin | 50,86 |
Oper_margin | 31,66 |
Pretax_margin | 32,47 |
Profit_margin | 26,79 |
Fcf_margin | 31,93 |
Ebitda_margin | 35,62 |
Ebit_margin | 32,40 |
R&d | 4.446.366.103,00 |
Forward_ps | 8,45 |
Pdivfcf_ratio | 29,92 |
Peg_ratio | 1,51 |
Evdivsales | 9,23 |
Fwd_evdivs | 8,17 |
Evdivebitda | 25,92 |
Evdivfcf | 28,91 |
Earnings_yield | 2,80 |
Fcf_div_ev | 3,46 |
Payout_ratio | 32,66 |
Buyback_yield | 0,13 |
Shareh_yield | 1,02 |
Rel_volume | 64,30 |
Gap_% | -0,01 |
Chg_open_% | -1,54 |
Rsi | 49,56 |
Rsi_w | 44,40 |
Rsi_m | 48,56 |
Atr | 22,90 |
Short_%_shares | 0,42 |
Shares | 387.668.143,00 |
Float | 393.003.400,00 |
Shares_ch_yoy | |
Shares_ch_qoq | |
Shares_insiders | 0,01 |
Shares_institut | 19,06 |
Earnings_date | 2025-01-29 |
Earnings_time | bmo |
Is_spac | No |
Options | Yes |
Ex-div_date | 2025-02-11 |
Payment_date | 2025-02-19 |
Roe | 48,00 |
Roa | 17,80 |
Roe_5y | 52,00 |
Roa_5y | 18,16 |
Roic_5y | 35,20 |
Yahoo Finance | https://finance.yahoo.com/quote/ASML |